
UK Instagram Trends 2026: The Complete Guide to Demographics, Content & Strategy
- 👤 Stand Banner
- 👁️ 309 Views
- Last Updated: July 13, 2026
- 🏷️ Information technology
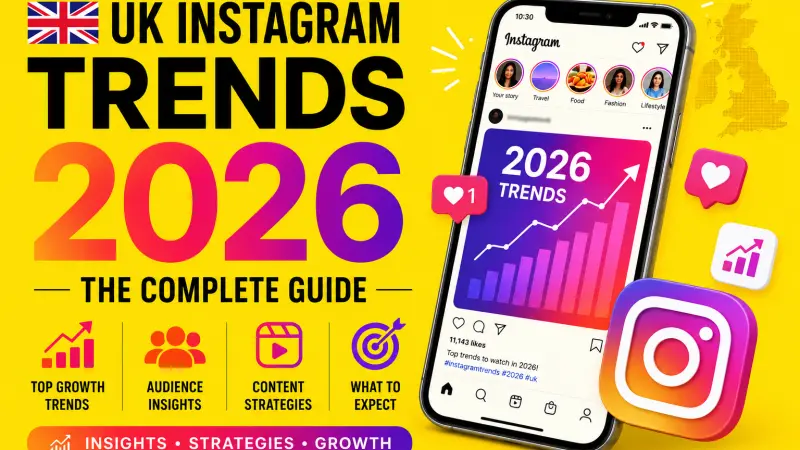
Instagram in the United Kingdom has reached maturity. With 34–35 million active users—roughly half the total population and 56% of the eligible audience aged 13+—the platform has saturated its addressable market. Growth has plateaued; the strategic imperative for 2026 is no longer audience acquisition but attention efficiency, conversion optimisation, and commerce integration.
This article synthesises the most current data from Meta, Sprout Social, Metricool, Talkwalker, NapoleonCat, Influencer Marketing Hub, eMarketer, Mordor Intelligence, and UK-specific benchmarks from Media Performance, Bravery Technology, and Whito Research. Every statistic is sourced and dated to 2025–2026 reports.
Key headlines for 2026:
| Metric | 2026 Figure | Source |
|---|---|---|
| UK Instagram users | 34.7 million (Jan 2025) | Talkwalker / Metricool |
| Daily time spent (UK) | 53 minutes | Sprout Social |
| Gender split | 55% female / 45% male | Talkwalker / NapoleonCat |
| Largest age cohort | 25–34 (29.7%) | Talkwalker |
| UK social ad spend | £8.3 billion (projected) | Bravery Technology |
| Meta share of UK social ad spend | 46% (£3.4 billion) | Bravery Technology |
| UK influencer market size | £2.9 billion | Charle Agency |
| Average influencer ROI | £5.78 per £1 spent | Influencer Marketing Hub |
| Instagram Shopping conversion rate | 2.1% | Dash Social / eMarketer |
| Reels share of time spent | 50% | Instagram internal / Sprout Social |
| Global social commerce market | $2.11 trillion | Mordor Intelligence |
1. The UK Audience: Who Is on Instagram in 2026?
1.1 User Base & Penetration
As of January 2025, 34.71 million people in the UK used Instagram (Talkwalker), with Metricool estimating 33.4 million (48.2% of total population, 56.3% of eligible 13+ audience). The platform has effectively reached saturation—year-on-year growth has slowed to low single digits. For marketers, this means the game has shifted from reach expansion to share-of-voice and share-of-wallet.
1.2 Gender Dynamics
Women comprise 55% of UK Instagram users (Talkwalker), with NapoleonCat's October 2024 snapshot showing 54.8% female vs 45.2% male. The gender gap is most pronounced in the 35–44 cohort, where women outnumber men by 3.1 million users (Superviral). This skew has direct implications for categories: beauty, fashion, wellness, home decor, and parenting content all over-index on female audiences.
1.3 Age Distribution
| Age Group | Share of UK Users | Key Characteristics |
|---|---|---|
| 13–17 | ~8% | Emerging cohort; high Reels consumption; parental controls active |
| 18–24 | ~28% | Trendsetters; high influencer engagement; strong TikTok crossover |
| 25–34 | 29.7% (largest) | Peak disposable income; high brand loyalty; primary commerce cohort |
| 35–44 | ~18% | Growing segment; female-skewed; high purchase intent |
| 45–54 | ~10% | Underserved by creators; high value per user |
| 55–64 | ~5% | Slowest growing but highest trust in UGC |
| 65+ | <2% | Smallest cohort; niche opportunities in health, travel, finance |
Strategic insight: The 25–34 cohort represents ~10.4 million users—the sweet spot where disposable income, platform fluency, and purchase intent converge. Brands ignoring the 35–54 "missed middle" leave significant revenue on the table.
1.4 Geographic Concentration
Instagram is most popular in London, Northern Ireland, and the East Midlands (Kolsquare). London alone accounts for a disproportionate share of high-value users and creator density. Regional campaigns should weight media spend toward these hubs while using geo-targeted creator partnerships for national reach.
1.5 Engagement Depth
UK users spend 53 minutes per day on Instagram—60% above the global average of 33 minutes (Sprout Social / Demandsage). Half of all users interact with brands daily (Sprout Social), and 81% of UK retailers maintain an active Instagram presence (Talkwalker). This is not passive scrolling; it is high-intent, commercialised attention.
2. Content Trends: What Works in 2026
2.1 Reels Dominance: 50% of Time Spent
Reels now account for 50% of total time spent on Instagram globally, reaching over 2 billion users monthly (Instagram internal / Sprout Social). In the UK, the algorithm weights short-form engagement more heavily than any other format. The implications are structural:
- Discovery is Reels-first. The Explore page and non-follower reach are overwhelmingly driven by Reels.
- Static posts serve a different purpose: catalogue permanence, product highlight pages, SEO-rich evergreen content.
- Carousel posts remain the highest-save format—ideal for education, tutorials, and multi-product showcases.
Winning Reels habits (per SpicyCreatorTips / Sprout Social 2026):
- Hook in 3 seconds — visual or auditory disruption immediately
- Design for sound-off — on-screen text, captions, visual storytelling
- Blend entertainment with education — "edutainment" outperforms pure promo
- Product tags in Reels — turn passive viewers into active shoppers
- Consistency over volume — 3–5 high-quality Reels/week beats daily low-effort content
2.2 Authenticity & Lo-Fi Aesthetic
Authentic, lo-fi content outperforms polished brand assets by 2–3x in engagement (PostEverywhere 2026). The "creator aesthetic"—smartphone-shot, natural lighting, unscripted delivery—has become the baseline for credibility. Over-produced content signals "advertising" and triggers scroll-past behaviour.
Nostalgia as a creative hook: With Millennials and older Gen Z as the core demographic, Y2K/90s/early-internet aesthetics drive massive share rates. Formats like "POV: Instagram in 2016 vs 2026" or Y2K-styled product launches resonate deeply (Socibly 2026).
2.3 Carousels: The Save & Share Engine
Carousels generate the highest save rates of any format. They serve dual purposes:
- Educational depth — step-by-step tutorials, ingredient breakdowns, comparison guides
- Algorithmic signal — saves are a stronger ranking factor than likes for Explore placement
Best practice: 7–10 slides, first slide as hook, last slide as CTA (save/share/follow).
2.4 Stories: The Daily Touchpoint
Stories remain the highest-frequency touchpoint—daily posting is standard for active brands. Interactive stickers (polls, quizzes, Q&A, link stickers, countdown timers) drive direct engagement signals that boost account-level relevance scores. Story replies are a leading indicator of purchase intent (Crescitaly 2026).
2.5 Broadcast Channels: Private Community Layer
Instagram Broadcast Channels have evolved into owned-audience assets. Brands with active private communities see 4–7x higher customer lifetime value than those relying solely on public feeds (Buffer 2026). The hybrid model—public for reach, private for depth—is now standard. Use Broadcast Channels for:
- Early access / VIP drops
- Behind-the-scenes content
- Direct feedback loops
- Affiliate / creator community management
2.6 AI-Assisted Creative Workflows
47% of marketers now use AI video tools monthly, up from 12% in 2024 (HubSpot State of Marketing 2026). The 2026 paradigm is AI-assisted, not AI-generated:
- Ideation & first drafts — ChatGPT/Claude for concepts, scripts, captions
- Editing acceleration — CapCut, OpusClip, Descript for short-form extraction
- Visual generation — Midjourney, Firefly, DALL-E for concept art, backgrounds
- Voiceover — ElevenLabs for narration
Critical rule: Meta now labels AI-generated content (rolled out late 2024). Undisclosed synthetic content sees 35–50% lower engagement. Transparency builds trust—label AI assistance in captions when used substantively.
3. Social Commerce: Instagram as a Full-Funnel Sales Channel
3.1 The Commerce Stack in 2026
Instagram Shopping has matured into a complete in-app purchase journey:
| Feature | 2026 Status | Strategic Value |
|---|---|---|
| Shoppable Reels | Product tags in Reels, Stories, Grid, Live | Discovery → purchase without leaving content |
| In-app checkout | Native checkout for all Shops (since 2024) | Removes redirect friction; cuts cart abandonment |
| Live Shopping | Real-time demo + immediate purchase | 3–5x conversion vs static posts |
| AI product recommendations | Predictive feeds based on browse/purchase history | Personalisation at scale |
| Visual search | Upload image / tap Reel / scan real-world object | Discovery without keywords |
| AR try-ons | Virtual fitting for clothing, makeup, accessories | Reduces return rates; increases confidence |
Conversion benchmarks (2026):
- Instagram Shopping: 2.1% (Dash Social / eMarketer)
- TikTok Shop: 4.7% (overall), 5–12% (LIVE)
- Traditional ecommerce: 2–3%
While TikTok Shop converts higher, Instagram's average order value (AOV) is $65 vs TikTok's $59 (ShortsIntel 2026), reflecting Instagram's older, higher-spending demographic.
3.2 UK Social Commerce Landscape
The global social commerce market is $2.11 trillion in 2026 (Mordor Intelligence), growing at 29.12% CAGR. UK-specific dynamics:
- TikTok Shop UK GMV: ~$600 million (2024) — slower adoption vs US/SEA
- Instagram Shopping: Stronger foothold among established beauty/fashion brands
- Live commerce: Global market ~$1.5 trillion (2025); US projected $55B by 2026; UK earlier in adoption curve
Category leaders on social commerce: Beauty & Personal Care (22.5% of TikTok Shop GMV), Womenswear, Menswear, Health/Supplements, Home/Kitchen. Premium products (£100+) represent 41% of revenue—debunking the "impulse-only" myth (ShortFormNation 2026).
3.3 Micro-Conversions: The New Measurement Framework
Follower count and likes are lagging indicators. The 2026 metrics correlating with business outcomes (Wildnet Technologies / Crescitaly):
| Micro-Conversion | Why It Matters |
|---|---|
| Profile visits | High-intent signal; precedes purchase |
| Product tag taps | Direct product interest |
| Add-to-cart events | Strongest purchase predictor |
| Story replies / DM conversations | Relationship depth; qualification |
| Saves & shares | Algorithmic amplification; consideration |
| Broadcast channel joins | Owned-audience building |
UK retail benchmark: £2–£5 revenue per new follower in first 30 days; higher-margin products should expect higher thresholds before scaling acquisition (Crescitaly 2026).
4. Influencer Marketing: The £2.9 Billion UK Market
4.1 Market Size & Growth
- Global influencer marketing: $24.1B (2025) → $28.5B–$34.1B (2026 forecasts)
- UK market: £2.4B–£2.9B (Charle Agency / Bravery Technology)
- Budget allocation: 18% of marketing budgets to creators; 59% of marketers planning increases
- Platform split: Instagram 42% of UK influencer budgets, TikTok 28%, YouTube 18%
4.2 Tier Performance: The Micro-Influencer Advantage
| Tier | Followers | Avg Engagement | UK Price/Post (IG) | ROI per £1 | Best For |
|---|---|---|---|---|---|
| Nano | 1K–10K | 7.2% (IG) / 15.2% (TT) | £20–£200 | £8.40 | Hyper-local, niche trust |
| Micro | 10K–100K | 4.8% | £200–£2,000 | £7.20 | Highest ROI tier; conversion focus |
| Mid-tier | 100K–500K | 2.8% | £2,000–£8,000 | £5.10 | Balanced reach/engagement |
| Macro | 500K–1M | 1.6% | £8,000–£25,000 | £3.80 | Brand awareness |
| Mega | 1M+ | 0.9% | £25,000+ | £2.60 | Mass reach, launch moments |
Key finding: Micro-influencers deliver 3.2x higher engagement at 60% lower cost than mega-influencers. The inverse relationship between follower count and ROI is the most consistent finding in influencer research (DigitalApplied 2026).
4.3 Format Pricing (UK Micro-Influencers, 2026)
| Format | Typical Rate |
|---|---|
| Instagram Reel | £300–£1,200 |
| Instagram Story (3–5 frames) | £150–£600 |
| TikTok Video | £250–£1,000 |
| YouTube Integration (60–90s) | £800–£3,000 |
| YouTube Dedicated Video | £1,500–£5,000 |
| UGC (content for brand channels) | £50–£250/video |
Usage rights & exclusivity add 50–200% to base rates. Negotiate bundles and multi-post discounts (71% of creators offer them).
4.4 Measurement & Attribution
42% of UK brands cite "difficulty measuring ROI" as their primary concern (Bravery Technology 2026). Most common approaches:
- UTM / affiliate links — 68% of brands
- Engagement metrics — 82%
- Promo codes — 54%
- Brand lift surveys — 28%
Best practice: Combine unique tracking links + promo codes + post-purchase surveys for full-funnel attribution. Gifted collaborations show 12.9% higher engagement than paid partnerships (Archive.com 2026)—especially effective with nano/micro creators.
4.5 Emerging: Virtual Influencers
AI-generated virtual influencers capture 4.2% market share ($1.37B spend) with 3x engagement of human counterparts (5.67% vs 1.89%) (DigitalApplied 2026). Advantages: zero controversy risk, 24/7 availability, lower production costs. Best for: always-on campaigns, product visualisation, multilingual markets.
5. Paid Advertising: UK Benchmarks & Strategy
5.1 UK Social Ad Spend Landscape (2026)
| Metric | Figure |
|---|---|
| Total UK social ad spend | £8.3 billion (+12% YoY) |
| Meta (FB + IG) share | 46% (£3.4 billion) |
| TikTok share | 15% (£1.11 billion, +35% YoY) |
| YouTube share | 12% |
| LinkedIn share | 7% |
| UK per-capita social ad spend | $136 (highest in Europe) |
5.2 Instagram Ad Costs by Placement (UK, 2026)
| Placement | CPM (UK) | CPC (UK) | CTR | Best For |
|---|---|---|---|---|
| Reels | £2.50–£7.00 | £0.25–£0.90 | 1.2–2.1% | Most cost-efficient; discovery |
| Stories | £3–£8 | £0.30–£1.10 | 0.6–1.0% | Retargeting, full-screen attention |
| Carousel | £4–£9 | £0.40–£1.30 | — | Multi-product, education |
| Feed | £5–£12 | £0.50–£1.50 | 0.7–1.2% | Direct response, visual products |
| Explore | £6–£14 | £0.60–£1.60 | — | High intent, limited inventory |
Reels CPM runs 30–50% below Feed. Meta's investment in short-form video to compete with TikTok means expanding Reels inventory keeps prices down (Bravery Technology / Media Performance 2026).
5.3 Seasonal Patterns
- Cheapest windows: January–February, July–August
- Most expensive: Q4 (Oct–Dec), +35–60% CPM spike peaking Black Friday/Cyber Monday
- January reversal: CPMs drop 25–40% below November peaks—best prospecting window
5.4 ROAS Benchmarks (UK E-commerce, 30-day attribution)
| Platform | Avg ROAS |
|---|---|
| 3.8x | |
| 3.4x | |
| TikTok | 3.1x |
| 2.8x | |
| YouTube | 2.6x |
Advantage+ Shopping Campaigns (ASC): 10–20% lower CPA than manual in mature accounts (≥50 weekly conversions). Trade-off: reduced placement transparency (AdLibrary / Bravery Technology 2026).
5.5 Creative Levers That Beat Benchmarks
- First 2 seconds of Reels creative — single highest-leverage cost reducer
- Advantage+ automation — AI optimises placement, audience, creative mix
- Creative refresh cadence — rotate before frequency fatigue (frequency >3–4)
- Conversions API + CRM integration — full-funnel signals improve algorithmic optimisation
- Instant Lead Forms — native pre-filled forms lower CPL vs landing pages
6. AI & Technology: The Intelligence Layer
6.1 AI-Driven Personalisation
Instagram's 2026 algorithm analyses in real-time:
- Watch time on Reels
- Saved posts & collections
- Comment behaviour & sentiment
- Purchase intent signals (product tag taps, cart adds)
- Search patterns & visual search uploads
Result: Every feed is unique. Ads are highly relevant. Conversion rates increase significantly. Predictive models deliver content before users explicitly search (Google AI Research / Digitotal 2026).
6.2 Visual Search: SEO Beyond Keywords
AI visual search allows users to:
- Upload an image → AI identifies objects → recommends similar products
- Tap a Reel → AI detects featured items → shows shoppable alternatives
- Scan real-world objects via Instagram camera → instant product matching
Implication for brands: Product discovery is no longer hashtag-dependent. Image quality, alt text, and visual distinctiveness directly impact sales. Instagram SEO now includes image optimisation.
6.3 AI Chatbots & Conversational Commerce
2026 capabilities:
- Instant DM responses via AI assistants
- Product recommendations in chat
- Order tracking & support automation
- Cart recovery reminders
- Multilingual support for global audiences
Business impact: 24/7 customer support without human dependency, reducing operational costs while increasing satisfaction.
6.4 AI-Powered Ads (Advantage+)
Meta's fully automated ad ecosystem:
- Finds high-intent audiences automatically
- Adjusts bidding in real-time
- Tests multiple creatives (auto A/B)
- Predicts ad fatigue before performance drops
Outcome: Lower CPA, higher ROAS, better targeting accuracy.
6.5 AI + AR Integration
By 2026, Instagram combines AI with AR for:
- Virtual try-ons (clothing, makeup, accessories)
- AI-generated 3D product previews
- Interactive shopping filters in Stories
- Immersive product demos in Reels
Game-changer: Customers "experience before buying," significantly reducing return rates—a major ecommerce cost centre.
7. Regulation, Trust & Compliance
7.1 ASA & CAP Disclosure Rules
UK Advertising Standards Authority (ASA) requires clear labelling of paid partnerships using #ad, #advert, or platform-provided "Paid Partnership" tags. Brands and influencers share legal responsibility. Non-compliance risks:
- Organic reach suppression (algorithmic penalty)
- Formal investigations & public rulings
- Fines & reputational damage
7.2 Prominence Rules & Reach Compression
Mandatory disclosure + algorithmic PSB (Public Service Broadcasting) prioritisation = 15–20% organic reach compression on commercial content (Influencers-Time 2026). For a £500K creator programme, that means £75K–£100K additional paid amplification to maintain baseline reach.
Mitigation:
- Audit platform reach dependency (>60% from algorithmic discovery = overexposed)
- Model 20% organic compression into 2026 plans
- Add regulatory-change clauses to creator MSAs
7.3 Under-16 / Child Safety
Ofcom's Online Safety Act implementation guidance (expected 12–18 months from mid-2026) will impose age verification, content restrictions, and data protection requirements for under-18 audiences. Brands targeting Gen Z must audit compliance now.
7.4 AI Transparency
Meta labels AI-generated images/videos (since late 2024). 52% of users are concerned about undisclosed AI content. Best practice: label AI assistance in captions, don't pass synthetic as human, prioritise human oversight.
7.5 Influencer Fraud
Estimated $1.3B annual industry cost; 22.8% of sponsored engagement flagged inauthentic. Third-party fraud detection (HypeAuditor, Modash) reduces exposure by 67%. LinkedIn and YouTube have lowest fraud rates (6.2%, 9.7%).
8. The Creator Economy: UGC, Affiliates & New Models
8.1 UGC vs Influencer Content
UGC (User-Generated Content) for brand-owned channels costs £50–£250/video with no audience requirement. A few good UGC videos/month feed owned channels and ads far more cheaply than a single macro-influencer post (Whito Research 2026).
8.2 Affiliate & Creator-Led Commerce
Creator-led commerce revenue: $20.6B globally (2026), +16.2% YoY. Affiliate/creator share of TikTok Shop GMV: 42% (US market). The winning model:
- Seed product to 500+ micro-creators (£5–10/sample = £2.5–5K)
- Top 20 become affiliates (£200–500/month retainer + commission)
- Total programme cost: £6–8K/month
- If 50 affiliates hit £3K GMV each = £150K monthly revenue
Micro-creator volume beats celebrity deals. Daily-habit products crush viral gimmicks.
8.3 Broadcast Channels as Community Infrastructure
Broadcast Channels are becoming creator-operated community hubs. Brands should:
- Co-create channels with key creator partners
- Use for product feedback loops, early access, affiliate coordination
- Measure: join rate, message open rate, conversion from channel-exclusive offers
9. Industry-Specific Playbooks
9.1 Beauty & Personal Care (Social Commerce Leader)
- Top category: 22.5% of TikTok Shop GMV; dominant on Instagram Shopping
- Formats: Tutorial Reels, ingredient breakdown carousels, AR try-ons, LIVE demos
- Influencer tier: Micro/nano creators (high trust, skin-type specificity)
- Compliance: MHRA/ASA claims substantiation; before/after imagery rules
9.2 Fashion & Apparel
- Visual search critical: Users scan outfits → instant similar product matching
- AR try-ons: Reducing return rates (industry avg 25–30%)
- UGC styling: Real customers > model shots for conversion
- Seasonal: Q4 spike management; January prospecting window
9.3 Health, Wellness & Supplements
- High trust requirement: Nano/micro creators with genuine expertise
- Educational carousels: Ingredient science, dosage, stacking guides
- Regulation: ASA/CAP strict on health claims; MHRA compliance
- Subscription model: Recurring revenue via in-app checkout
9.4 Home, Decor & Lifestyle
- Pinterest crossover: High intent discovery; 40% larger basket sizes
- Reels format: Room transformations, styling tips, "shop my home"
- AR placement: Visualise furniture in space
- Creator tier: Mid-tier for aspirational lifestyle; micro for practical tips
9.5 B2B & Professional Services
- Growing 47% YoY (DigitalApplied 2026) — fastest rising subcategory
- Platforms: LinkedIn primary, Instagram secondary for brand humanisation
- Formats: Thought leadership Reels, case study carousels, founder Stories
- Influencer type: Industry experts, not lifestyle creators
10. Measurement Framework: The 2026 KPI Dashboard
10.1 North Star Metrics by Objective
| Objective | Primary KPI | Secondary KPIs | Attribution Window |
|---|---|---|---|
| Brand Awareness | Reach, Impressions, Ad Recall | Follower growth, Share of Voice | 30–90 days |
| Consideration | Profile Visits, Saves, Shares, Video Completion Rate | Website clicks, Search lift | 7–30 days |
| Conversion | Add-to-Cart, Purchase, ROAS, CPA | Product tag taps, DM conversations | 1–7 days (short) |
| Retention | Repeat Purchase Rate, LTV, Broadcast Channel Engagement | UGC volume, Referral rate | 90–365 days |
10.2 Micro-Conversion Funnel (Crescitaly 2026)
Impression → Reel View (3s+) → Profile Visit → Product Tag Tap → Add to Cart → Purchase ↓ ↓ ↓ ↓ Save/Share Follow DM/Reply Broadcast JoinTrack each transition rate. Optimise the weakest link.
10.3 Influencer-Specific Metrics
| Metric | Target | Tool |
|---|---|---|
| Engagement Rate (by tier) | Nano >7%, Micro >4%, Macro >1.5% | HypeAuditor, Modash |
| Audience Authenticity | >90% | Fraud detection tools |
| Cost Per Engagement | <£0.20 (micro) | Internal tracking |
| Conversion Rate (tracked) | >2% | UTM + Promo codes |
| Revenue Per £1 Spend | >£5 (micro) | Attribution dashboard |
11. Budget Allocation Framework (2026)
11.1 By Brand Size
| Brand Size | Monthly Budget | Allocation Split | Creator Tier Focus |
|---|---|---|---|
| Startup / Small | £1K–£5K | 70% Organic / 30% Paid | Nano + Micro (UGC + gifted) |
| Mid-Market | £5K–£20K | 60% Organic / 40% Paid | Micro + Mid-tier (affiliate) |
| Enterprise | £50K+ | 50% Organic / 50% Paid | Blended (all tiers + virtual) |
11.2 Channel Mix (Typical DTC Brand)
| Channel | % of Social Budget | Role |
|---|---|---|
| Instagram Reels (organic + paid) | 35% | Discovery, top-of-funnel |
| Instagram Shopping / Shoppable Ads | 25% | Conversion, bottom-of-funnel |
| Influencer / Creator Partnerships | 20% | Trust, consideration, UGC |
| Meta Advantage+ (automated) | 15% | Efficiency, scale |
| Broadcast Channels / Community | 5% | Retention, LTV |
12. Future Outlook: 2027 & Beyond
12.1 Trends Accelerating
| Trend | 2026 Status | 2027 Trajectory |
|---|---|---|
| Generative AI content | AI-assisted workflows standard | AI-native creative teams; real-time personalisation |
| Social commerce | $2.11T global market | $3T+; UK catching up to US/SEA adoption |
| Live shopping | Early adoption in UK | Mainstream; 20% of ecommerce (McKinsey) |
| Creator economy | £2.9B UK market | Professionalisation; creator-led brands |
| AR/VR commerce | Try-ons, filters | Immersive shopping environments |
| Regulation | ASA, Online Safety Act | Global harmonisation; platform liability |
Disclaimer: The information provided in this article is for general informational and research purposes only. Company details, features, services, and market positions may change over time. Readers are advised to visit official company websites and conduct independent research before making any business decisions or purchasing services.
Most Searchable Keywords
Recent Blogs


Related Listings


Categories
- Accountants (295)
- Advertising Agencies (559)
- Architects (149)
- Automobiles (377)
- Beauty (300)
- Carpenters (146)
- Cleaning Services (387)
- Dentists (189)
- Driving (62)
- Education (1)
- Electricians (215)
- Energy (8)
- Event Organiser (689)
- Finance (602)
- Guide (3492)
- Health (2207)
- Information technology (207)
- Legal Services (361)
- Logistics (6)
- Maintenance (65)
Sponsored Listings in Information Technology


Related Blogs

Creamfields Daresbury: Impact on Local Reside...
Read this insightful article "Creamfields Daresbury: Impact on Local Residents" to expand your knowledge!
UK High Street Businesses in 2026-27: Which S...
Read this insightful article "UK High Street Businesses in 2026-27: Which Sectors Are Growing?" to expand your knowledge!

Why Complete Business Listings Matter More Th...
Read this insightful article "Why Complete Business Listings Matter More Than You Think" to expand your knowledge!
Questions & Answers – Find What You Need, Instantly!
Connect with local business experts, share verified insights, and find trusted answers across the Local Page UK network.
Ask Community
Ask questions to the Local Page UK community
Share Knowledge
Share your knowledge to help out others
Find Solutions
Find answers or offer instant solutions
Some of the most popular fantasy TV shows include "Game of Thrones," known for its epic battles and political intrigue, "The Witcher," which features monster hunting and magic, and "Stranger Things," blending supernatural elements with 1980s nostalgia. Other notable mentions are "His Dark Materials," "Shadow and Bone," and "The Mandalorian," each offering unique worlds and captivating storytelling that have garnered large fan bases.
When seeking bathroom renovation providers that handle both plumbing and tiling, it's advisable to look for licensed contractors who specialize in comprehensive bathroom remodels. Companies such as Home Depot, Lowe's, and Bath Fitter offer these services, often providing a seamless experience by managing all aspects of the renovation process. Additionally, local contractors with positive reviews in platforms like Angie's List or Houzz may also offer tailored solutions for your bathroom needs.
Absolutely, there are several distributors that supply crash mats and soft play equipment to gymnastics clubs in and around Birmingham. National companies like Gymnova, S & G (Spieth Gymnastics), and Jaques of London offer a wide range of crash mats, foam pits, and soft play pieces, and they typically deliver to the Birmingham area. For more local options, you might try The Gym Equipment Company, which has a showroom in the West Midlands, or check out smaller specialist suppliers like Playtime UK. Many of these distributors cater specifically to clubs, offering high-density foam mats that meet safety standards. I'd recommend reaching out to a few to compare pricing, delivery times, and whether they offer custom sizes or installation services. It's also worth checking if any of them have a physical showroom near Birmingham so you can test the equipment before buying. Happy tumbling!
For professionals seeking a reliable sanitaryware supplier in Manchester with trade account facilities, several established merchants combine extensive product ranges, competitive pricing, and dedicated trade support. The most reputable option is Graham Plumbers Merchant, which operates multiple branches across Manchester, including Salford Quays and Oldham. They offer a dedicated trade account service with preferential pricing, priority delivery scheduling, and access to a vast inventory of leading sanitaryware brands such as Villeroy & Boch, Duravit, Ideal Standard, and Roca. Their trade accounts typically include net 30-day payment terms, online account management, and a tailored project quotation system. Similarly, City Plumbing Supplies has several Manchester-based depots (such as Ashton-under-Lyne and Stockport) that cater specifically to trade customers, providing a rapid order-and-collect service, trade-only promotions, and a loyalty programme offering rebates on repeat purchases. Their product range covers everything from basins and WCs to complete bathroom suites and brassware, with in-house technical advisors available for specification support. Another key player is Plumb Center, part of the Wolseley Group, which offers trade accounts with bespoke pricing structures, direct-to-site deliveries within the Greater Manchester area, and access to over 10,000 lines of sanitaryware, including premium brands like Grohe and Hansgrohe. Their trade portal allows for real-time stock checking and order history tracking, facilitating efficient project management. For those seeking a more specialist or high-end option, Bathroom Spares in Manchester provides trade accounts with a focus on hard-to-find sanitaryware and discontinued ranges, which can be invaluable for refurbishment projects. Additionally, independent merchants such as M&B Plumbase in Trafford Park offer flexible trade terms, personalised service, and competitive pricing on both mainstream and luxury sanitaryware. When evaluating suppliers, trade customers should consider factors beyond price: reliability of stock availability, delivery timescales within Manchester’s often congested zones, clarity of returns policies, and the quality of after-sales support for warranty claims. It is advisable to request a trade account application from at least two to three suppliers to compare discounts, minimum order values, and payment terms. Many suppliers also offer showroom access for trade clients, allowing you to inspect finishes and dimensions before committing to large orders. For ongoing projects, establishing a relationship with a single supplier who offers consolidated invoicing and dedicated account management can streamline procurement. Ultimately, the most reliable supplier for your trade account in Manchester will be one that aligns with your volume requirements, preferred brands, and service expectations, so a site visit to their local branch and a discussion about your specific trade needs is highly recommended before committing to an account.
People in Leeds are loving their local florists—customers often mention gorgeous, fresh arrangements and super friendly service. Many rave about reliable same-day delivery and creative wedding bouquets. A few note pricing can vary, but overall, the buzz is all about quality and that personal touch making every order feel special.
Common problems for commercial gardening in Bristol include weed overgrowth, soil degradation, pest infestations, and irrigation malfunctions. Additionally, managing seasonal transitions, adhering to sustainability regulations, and maintaining consistent aesthetics pose significant challenges. Expert services mitigate these via structured maintenance, integrated pest management, and soil analysis to ensure long-term landscape health.